Brief description:
Enterprise Data Analytics, hereinafter EDA, is a web application developed by Jortilles for data analysis and visualization. EDA is a web application specially designed to be easy to use by non-technical business users.
EDA is a modern web application developed under current design patterns, being responsive and adaptive.
EDA allows to generate logic models on a relational database. Apply data-level security and report on that logic model.
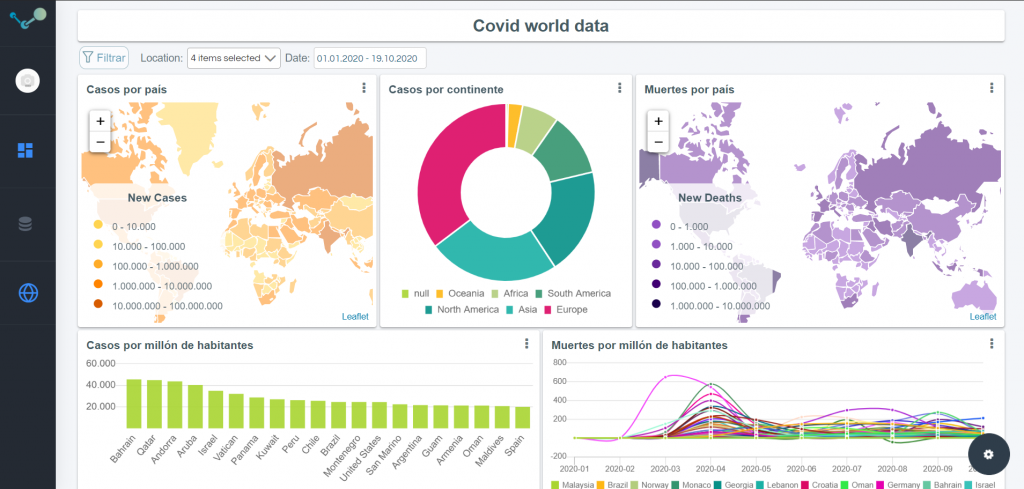
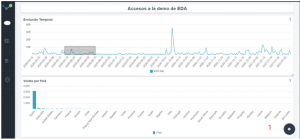
Below is an example of a report made with EDA:
1. Main Features
The main features and functionalities of EDA are described below.
Creation of logic models
EDA allows you to create a a logical data model from which business users can make reports in a simple and intuitive way.
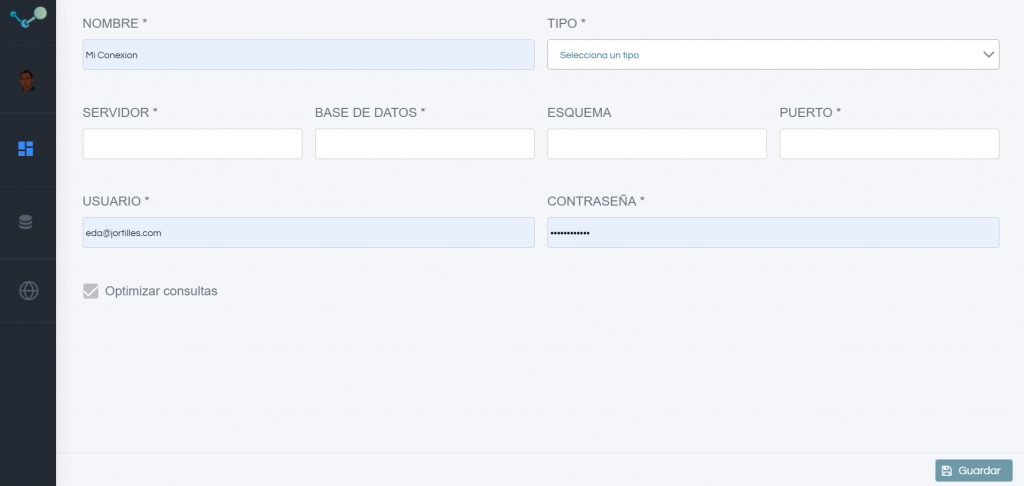
An administrator user can generate data models. To generate a data model, an administrator user must configure a connection to the database and give it a name:
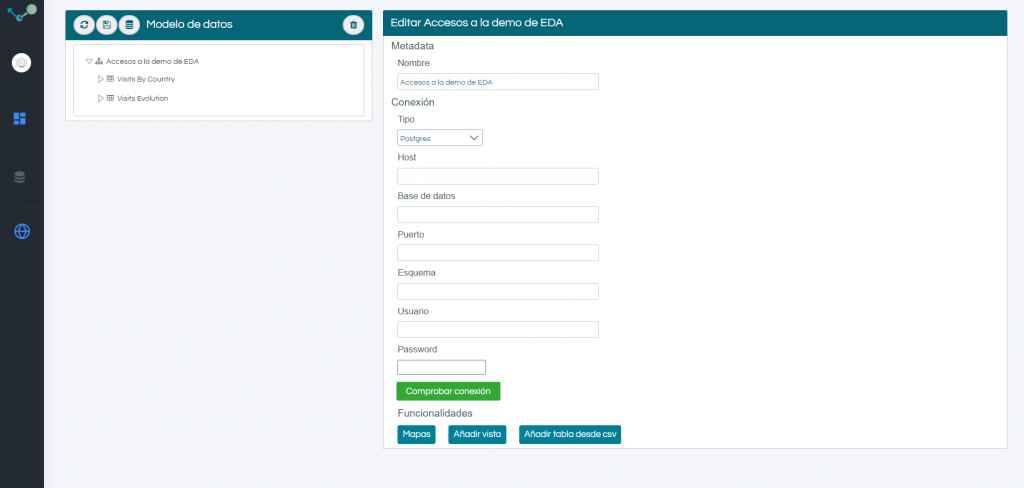
Once the connection data is provided, EDA will generate a logic model automatically. Generating:
- Entities from the tables and attributes from the columns.
- Relations between the different tables from columns with the same name and id format (fields containing id_, or fk_, or code, or nk_)
- If you check the option “Optimize Queries” we will also have statistics on the sizes of the tables that will be used to advise the user when making reports. Preventing unnecessary heavy queries.
Generating a logical model enriched with names and descriptions that will allow the business user to fully understand the content of the data model.
Data models can be enriched with:
- Views at the model level: Being able to define views at the logical model level that behave like new tables. This is especially recommended when you have complex queries that are used on a recurring basis. You can define a view at the logic model level.
- Generation of entities from a csv: Designed for dynamic environments. A new entity can be generated in the model from a csv of data. This functionality loads the data from the csv into a database table. This functionality is enabled only with models defined with Postgresql.
- Maps: Geojson files can be uploaded and linked to one (or more attributes) so that layer maps linked to those attributes can be generated.
The data models can be secured at the data level, allowing security to be defined at the row level. Security applies to the user of the session.
Connectors
The connectors to the different database management systems have been developed in a modular way. In this way incorporating a new connection to a new source is easy to implement.
At the time of writing, EDA connects to:
- Oracle
- SqlServer
- MySql
- Postgres
- Vertica
- Google Big Query
Model customization
EDA generates the data model in an automated way. But this is only a help. The data model can be customized:
- Hiding tables
- Hiding technical columns that do not have to appear in the model
- Renaming the tables or columns
- Generating meaningful descriptions
- Creating or removing relationships between tables
Main screen
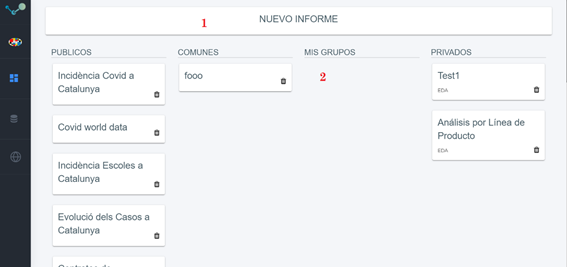
The application is designed to be especially easy to use. With a clear and intuitive main screen. Having the main functionalities just one click away:
Being able to generate a new report (1) or access an already defined report depending on the existing visibility level (2)
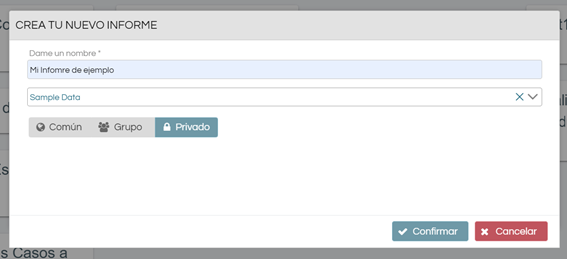
Report creation
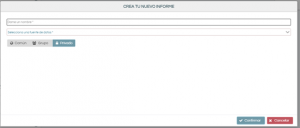
To create a new report, just click on the “new report” button on the main screen.
After which you have to give it a name and choose the data model on which the report will be made.
nce the report is configured, a “blank report” is generated with the title and a first available panel.
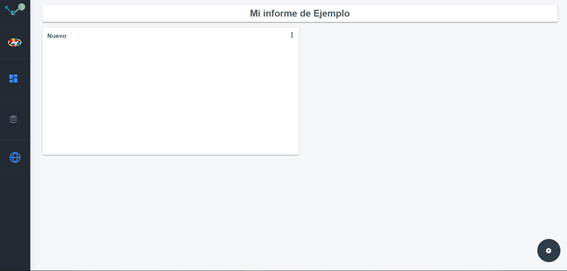
A report is configured by adding dashboards. The panels are the containers where we will place the different objects.
A report consists of:
- Pannels: A panel is a container where we will place a query object. Visualizing a graph, a map, an indicator, etc.
- Filters: Filters are located at the top of the report and can apply to one or more dashboards. Filters are multi-selector and can be date specific.
- Texts: EDA allows you to have explanatory texts in the reports to locate clarifications in them.
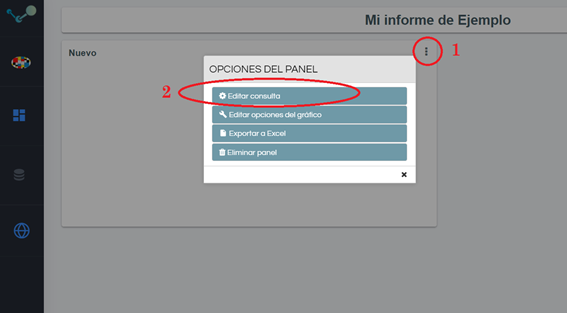
To configure a panel, click on the button located at the top right of the panel. Once the options window is open, the query on the data model can be edited.
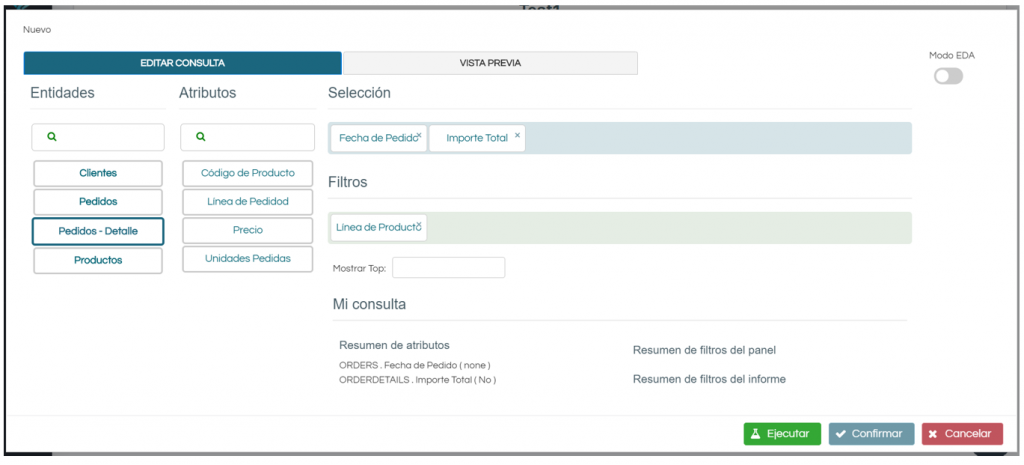
The interface for configuring a panel query is specially designed to be intuitive. Presenting entities and attributes with names defined in the data model and expressed in terms understandable by the user
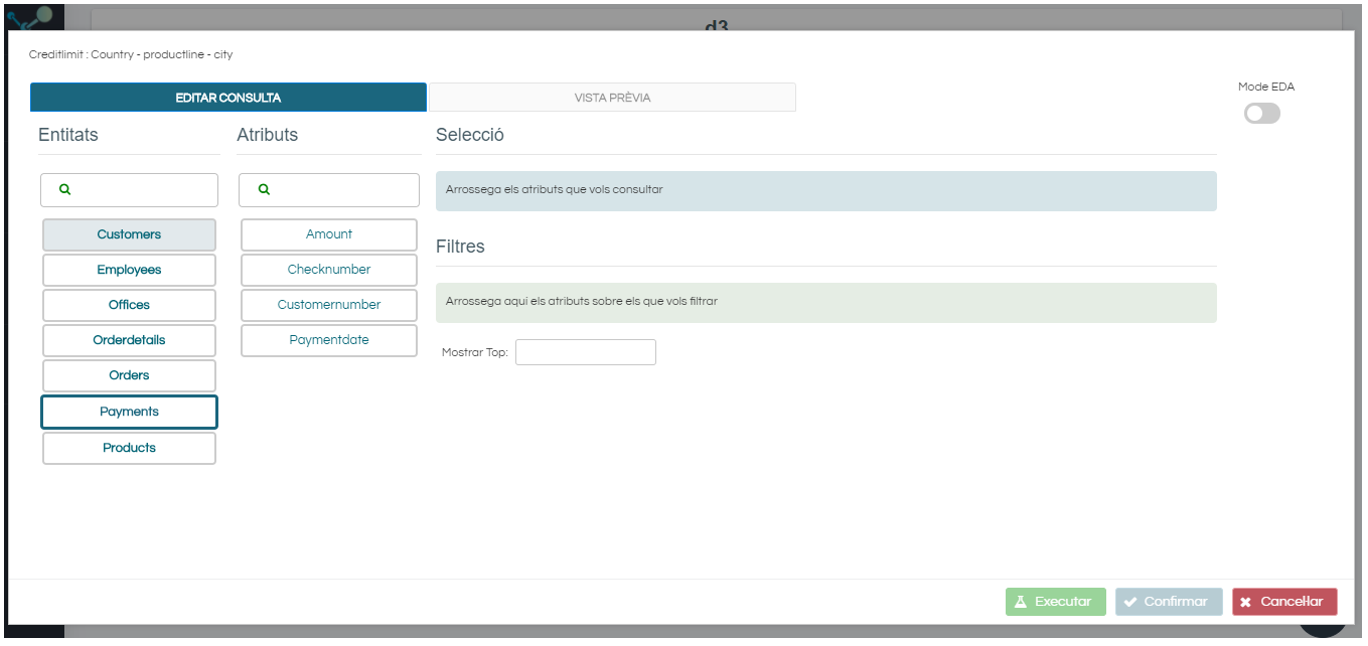
A user will only have to choose an entity, an attribute of said entity and drag the field to the selection box.
If you want to define a filter applicable to the panel query, you must drag the attribute to the filters box.
To filter by an attribute value, click on the attribute located in the selection bar or in the filter bar and define the desired filter.
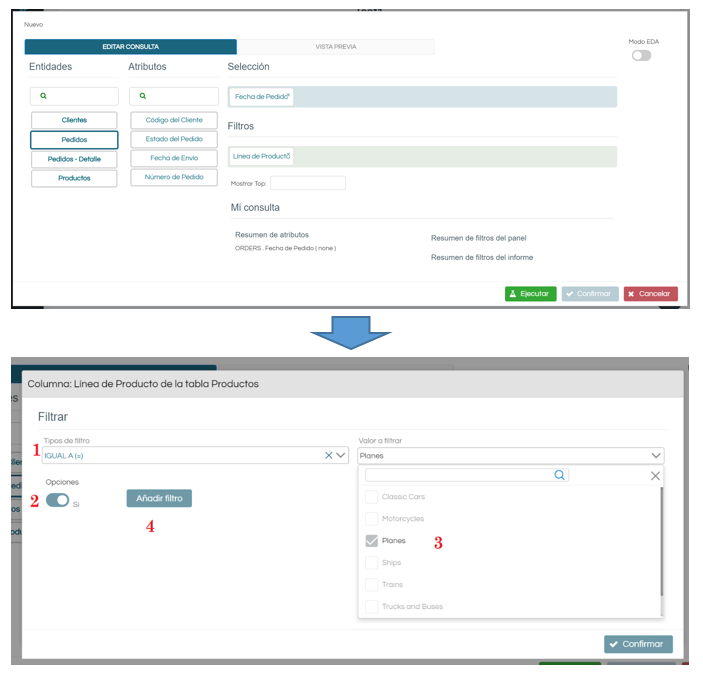
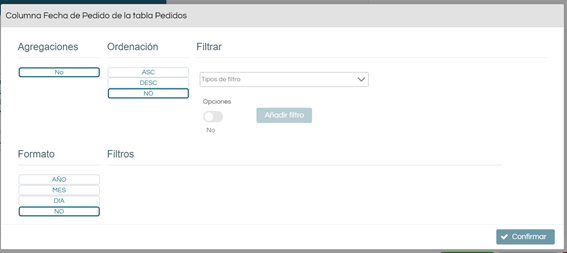
Once the attributes that we want to view and filters have been defined, we will proceed to configure the query defining orderings, aggregations and format, if applicable for each attribute. To do this, you just have to click on the name of the attribute and adjust the available options.
Finally, once we have the query defined, we can execute it:
After which a preview of the result will be shown. By default as a data table.
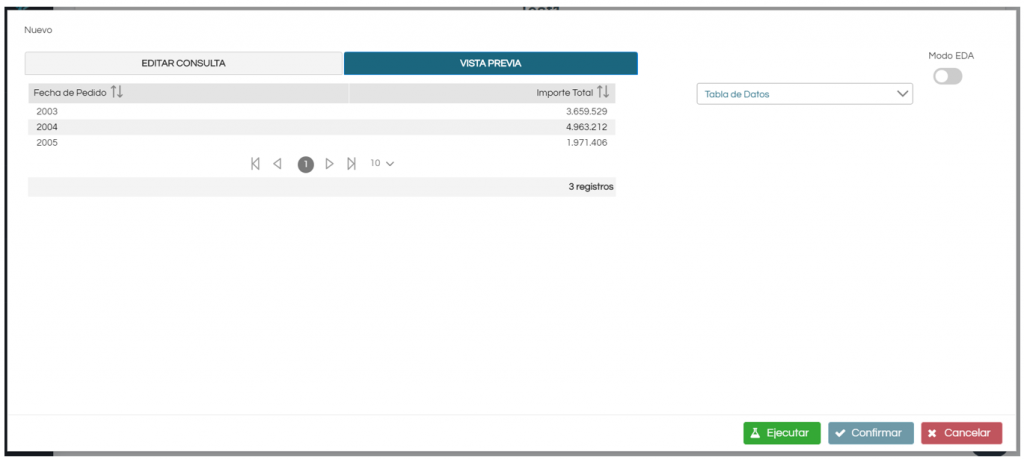
At this time you can choose the display. Maintain the data table or select one of the available visualizations for the chosen data.
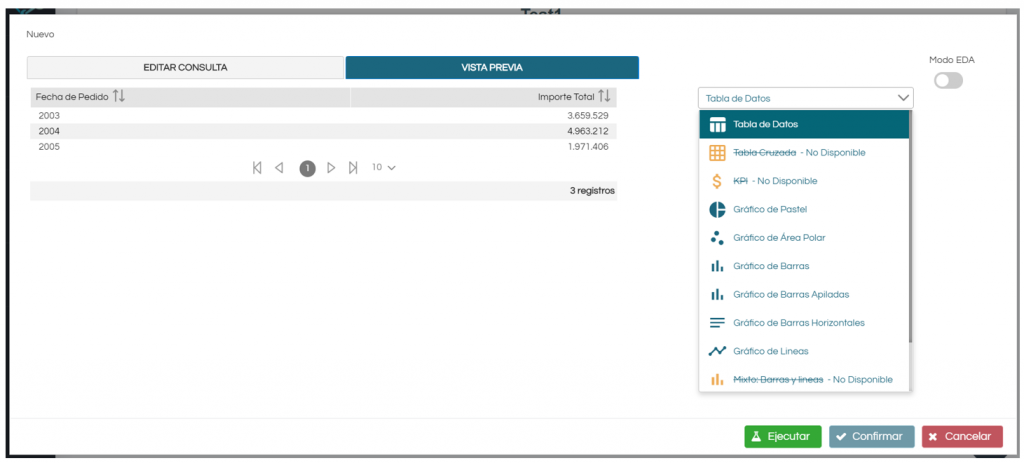
The list of views shows us the available options. Showing as not available those that, due to your specific requirements, are not possible to use. In case we hover the mouse over the option not available we will obtain an explanation of the reasons
Once the desired display has been chosen, the panel configuration can be confirmed to obtain the desired result.
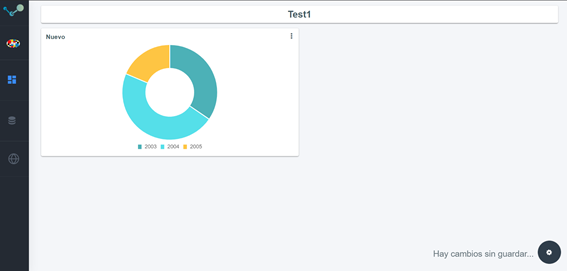
Every time we make a change in the report configuration, an alert will appear informing us that “There are unsaved changes”.
Panels can be resized at will on the design grid by clicking on an edge and dragging. If you click on the lower right point, you can define height and width.
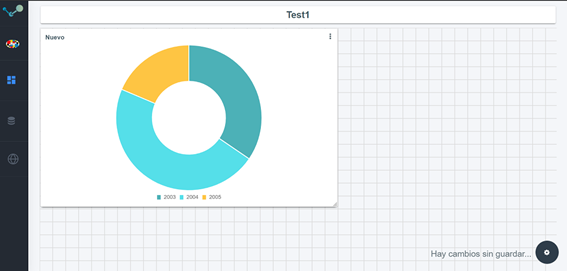
The panels can be moved to any position on the screen within the grid by clicking on the text and dragging it to the desired point.
Report Filters
A report can have filters based on the data model on which it is built.
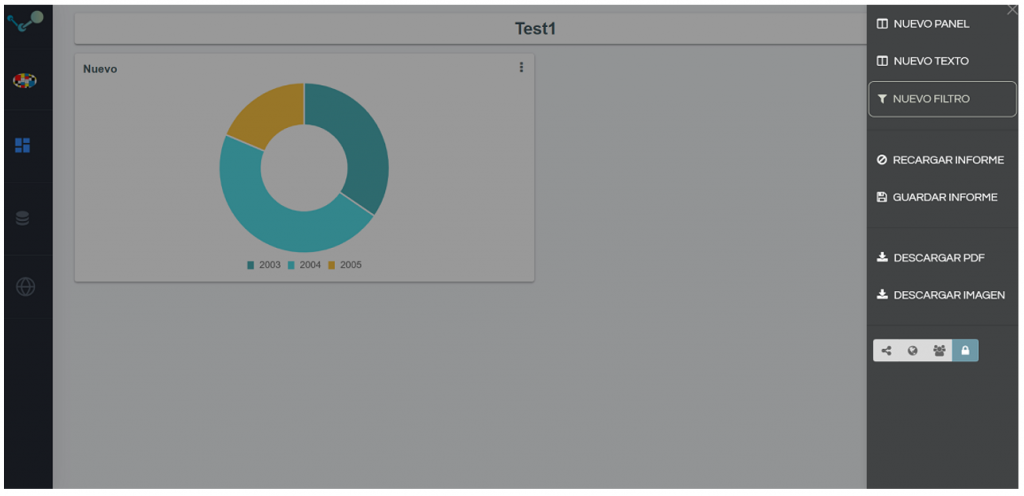
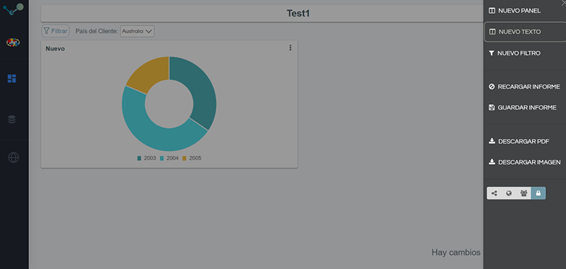
To add a new filter, click on the wheel at the bottom right of the screen. After which, the menu of actions associated with the report will appear and where we can add a new filter.
After which the filter configuration screen will appear where:
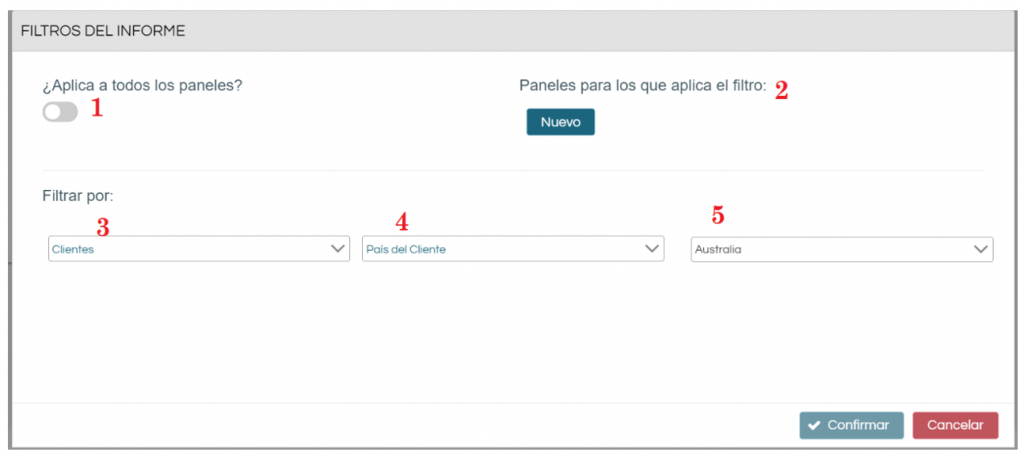
(1) We can decide if the filter applies to “the entire report” or only to some specific panels (2). And we can choose on which entity (3) and attribute (4) we want to filter.
In order to facilitate inquiries. Because the report keeps integrity. It is recommended to define the filters last. Once we have defined all the panels.
In case we have an unconfigured panel. We will not be able to define a new filter. We will have to configure all the report panels first and then the filters. The reason is again the integrity of the report.
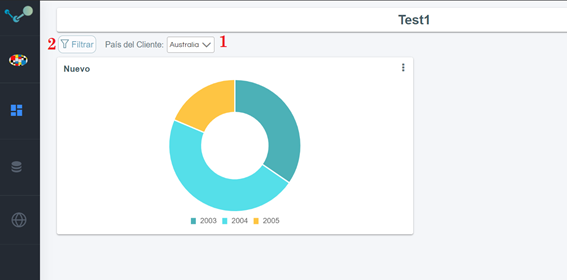
Since filters are multi-selector by default. To apply a filter, make the desired selection (1) and click on the “Filter” button (2)
Texts
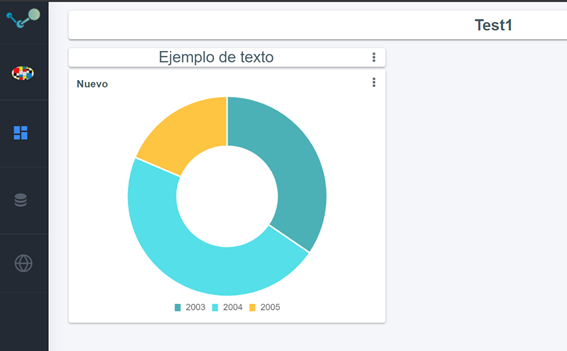
Sometimes it is necessary to include explanatory text somewhere in the report. The Text component has been created for this purpose. To be able to put a free text. In order to add a new text to the report, click on the lower right wheel and then on the button “New Text”
Available Views
At the time of writing this document it is possible to view the data as:
- Data table
- Crosstab
- KPI
- Pie chart
- Polar area chart
- Bar chart
- Stacked bar chart
- Horizontal bar chart
- Line chart
- Line & bar chart
- Coordenates map
- Layers map
- Sankey chart
Advanced queries
EDA places a special focus on ease of use and abstraction of the technical knowledge required to query a database. But sometimes it is necessary to use the power of SQL to perform some complex queries.
For this, EDA makes the “SQL Mode” available to advanced users. To access this mode, activate the switch located in the upper right part of the query definition dialog in the configuration of a panel (1)
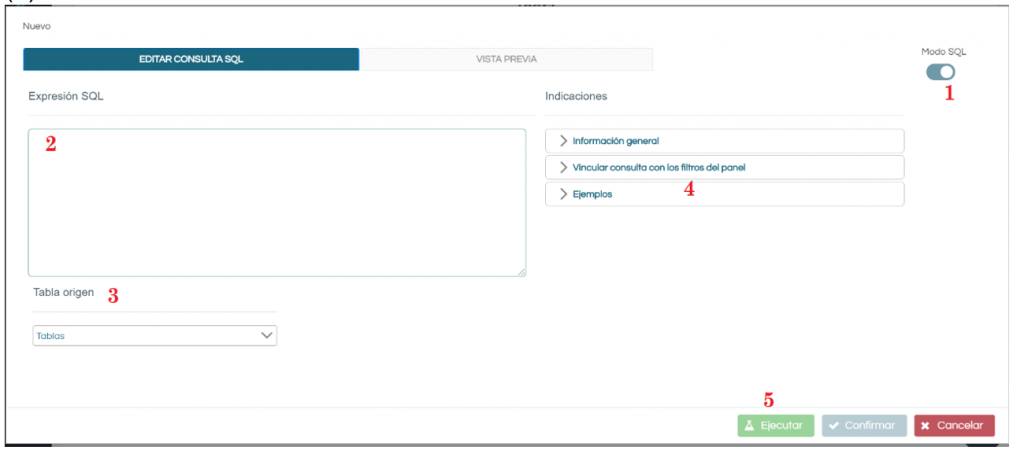
By activating this switch (1) it is possible to change from “EDA Mode”, the normal EDA mode to this “SQL Mode” where advanced users can define and execute native SQL queries against the database.
Once the “SQL Mode” switch (1) is activated, the user will be able to define his free SQL query in the text area provided for that purpose (2) and specify one of the main tables of the data model on which the database is based. report (3).
Queries. They are free native SQL queries taking into account the following restrictions:
- Queries must be on the same database schema on which the report is made. You cannot mix database schemas. In case you need tables from different schemas, we recommend generating views.
- Aliases must be used for tables. In other words, the queries must be defined with the following example structure “select a.field1, a.field2 from table a”
In order to facilitate advanced interaction with SQL queries, there is a help (3) on the same screen that will remind us:
- General recommendations
- How to link the report filters with our SQL query
- Examples of use.
After defining our sql (2) query and identifying the main table. We can now run the query and use it normally as if it were any other query from any other panel.
The native SQL queries are parsed by EDA and the possible data access filters that may exist in the model on which the report is based are injected.
If you want to link the query with the report filters, you must:
- To do so, you just have to add: AND $ {table_alias.filtered_column} in the ‘WHERE’ clause of the query where you want to inject the filter
- If you haven’t added a WHERE clause, add it to the query and do the necessary joins, along with the filter in the format ${alias_table.filtered_column}
- If the table we are filtering through is not in the query, remember that you must add the necessary JOIN clauses to be able to link the filter table with your query
Here are some examples:
- Simple query:
SELECT c.customername
FROM CUSTOMERS c
- Query with linked report filters:
- We have a filter in the report for the ‘city’ field of the CUSTOMERS table:
- Query without linked filters:
SELECT c.customername FROM CUSTOMERS c
WHERE c.customername IN (‘Julia’, ‘John’)
- Query with linked filters:
SELECT c.customername
FROM CUSTOMERS c
WHERE c.customername IN (‘Julia’, ‘john’) AND ${c.city}
- We have a filter in the report for the ‘office_id’ field of the OFFICES table
- Query without linked filters:
SELECT e.employee_name
FROM EMPLOYEE e
WHERE e.employee_name IN (‘Julia’, ‘John’)
- Query with linked filters:
SELECT e.employee_name FROM EMPLOYEE e
INNER JOIN OFFICES o ON o.office_id = e.office_id
WHERE e.employee_name IN (‘Julia’, ‘John’) AND ${o.office_id}
Security
Row Level Security
EDA allows row level security, both at the user level and at the group level.
Security is applied by assigning to each user or group a set of values of a data model’s column, these values are the ones that the user or group will be authorized to see, so that all the queries -both if they are of type EDA as if they are free queries – they will perform the security check before returning data.
The security check consists of determining the relationships between the query tables and the tables with permissions, if the tables are related, an inner join will be applied with the tables with permissions to filter the results to the user according to the defined permissions.
Consequently, the tables that are not related to those to which we apply security will not filter any information (they will show all the data).
Permissions can be applied to more than one column in the same table and to different columns of different tables.
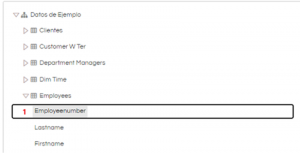
For example, suppose we have a table “Employees” that contains the IDs of EDA users, and that this table is linked to other tables in the data model.
From the model editing screen, we select the column on which the permissions will apply, in this case the table is “Employees” and the column is “Employeenumber”.
Once column (1) is selected, the edit menu for this column is displayed:
The “add permission” button (2) enables the menu for editing the permissions for this column, where we can choose whether we want to give user or group permissions (the operation is identical):
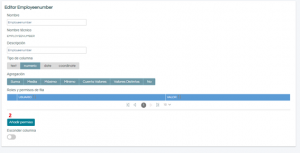
Once inside the permission editing panel, we select the desired user (or group) and the values that they are authorized to see. It is also possible to mark a user or group as authorized to see all the data by checking the “All” option.
From that moment on, all the queries that contain fields from tables related to the “Employees” table will filter the information based on the permissions given for that user or group.
Once we give group or user permissions, the model is marked as secured and from that moment on, a user or group without permissions cannot access any data of the model, that is: it is marked as a user without any permission, including the administrator.
This implies that when a report is generated, users without permissions will not see that model among those available, and that in case of accessing a report based on that model, an error will be thrown warning of the lack of permissions and empty panels will be displayed . The administrator will have access to the models and their edition, but not to their data.
In this way, once we give permissions there are three levels of users / groups:
- They can see everything (marked with the option “all”)
- They can see a part (they have some assigned values)
- They can’t see anything (no security defined)
If a user has group and individual permissions both apply, so if for example as a user you can see the values (1, 2, 3) and as a group you can see the values (4, 5, 6) in practice you will not be able to see any from them.
It is the administrator’s responsibility to grant the permissions consistent with the data model.
Report-level security
Reports can be marked as:
- Public: The URL of the report can be shared and anyone can see the information it contains.
- Common: The report is visible to any registered EDA user
- Group: The report is only visible to users of the group to which the creator of the report belongs
- Private: The report is only visible to the user who created it
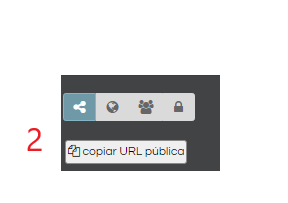
This classification can be assigned both when creating the report (1) and once it is created (2), except for the classification “public”, which must be assigned once the report is created and has a URL.
1.Reporting panel
2.Edit report permissions:
You can control the information shown in public reports by editing the data-level permissions for the “anonymous” user, created by default when installing the application.
Both dimensions of security (at the data level, at the report level) work together, so it is possible that two users from the same group have different permissions. In this case, both will be able to see the other’s group reports, but they will not necessarily see the same information, depending on the individual permissions assigned to them.
2. Application architecture
EDA is a web application developed following current programming techniques. Using Angular for the frontend and Node.js for the backend. How internal database of operation uses MongoDB.
As web server can you use Apache https server or NginX
EDA is an Open Source application and its code is freely accessible on Github ( https://github.com/jortilles/EDA )
3. Deployment and configuration
Jortilles offers EDA in SAS mode. In this way you can enjoy an EDA server always updated and managed by Jortilles for a monthly fee. If we choose this option, we will have an internet server for us under the url https://edaserver.com/mi_empresa
Docker
docker run -p 80:80 jortilles/eda:latest
Manual
There are several deployment options. Below is the basic configuration from which modifications can be made.
1. Clone the GIT repository:
git clone https://github.com/jortilles/EDA.git
2. Configure the database in eda_api/config/database.config.js
3. Configure the backend in eda_app/src/app/config/config.ts
4. Installl and run
cd eda_api
npm install
npm start
cd eda_app
npm install
npm start
4. Final thoughts
EDA is a product in constant development. This guide is based on version 1.4 of the product. In case of accessing a more recent version, this guide may be out of date. Existing functionalities not described.
Jortilles is the developer of EDA. In case of any doubt. Contact us at info@jortilles.com